Shipping Tiers and Cost Per Order for Western E-Commerce

Three Tiers That Actually Matter by Region
Most western e-commerce operators land in one of three service bands when they map their order volume against geography. Band one is the same-day or next-morning parcel, typically priced between $4.20 and $6.80 per unit for a 1-pound box within a 150-mile radius of a regional hub. Band two is the standard two-to-three-business-day ground service that covers most of the western continental US or the DACH-and-beyond zone in Europe, running $3.10 to $5.50 per parcel depending on weight and dimensional surcharges. Band three is the economy five-to-seven-day option that pushes past $2.40 per unit only when the customer has explicitly opted for it and you have absorbed no fuel or residential-delivery add-ons.
The critical variable in western markets is distance to the last-mile network. A parcel originating in Reno or Lyon faces a different carrier density than one leaving Phoenix or Munich, and that difference shows up as a 12-to-18-cent per-order premium on bands two and three. If you are choosing between two fulfillment partners within 60 miles of each other, run the actual zone-mix for your last 90 days of orders rather than relying on the carrier's published rate card; the zone mix is where the real cost lives.
A practical rule that saves operators roughly four to six hours per week of rate-shopping: lock in a band-one contract for your top 20 percent of SKUs (the ones with repeat-purchase velocity above 1.3), let everything else flow through band two, and reserve band three as an explicit customer choice at checkout. This keeps your average cost per order between $3.60 and $4.90 while preserving the speed perception that drives reorders.
Surcharges That Quietly Double Your Per-Order Cost
Fuel index adjustments in western markets have averaged 28 to 34 percent above base rates over the past two contracting cycles, and most operators bake in a flat 10-cent buffer that simply does not cover the swing when diesel or jet-fuel indices move. Residential delivery surcharges add $0.62 to $1.15 per parcel in suburban western corridors, and remote-area fees (what carriers call Zone 8 and beyond) can push a single order from $4.10 to $9.70 without any change in weight or dimensions.
The second hidden cost is dimensional weight recalculation. If your packing team uses uniform 12-by-12-by-6-inch boxes for a product that fits in 9-by-9-by-4, the carrier bills on the 1,296 cubic-inch equivalent rather than 576, and you are paying roughly $1.30 per parcel for air. A fifteen-minute audit of your top 50 SKUs against their actual packed dimensions has returned between $800 and $2,200 per month in recovered shipping cost for stores doing 400 to 1,200 orders weekly.
When you are comparing two logistics providers or two carrier contracts, ask for the all-in landed rate including fuel, residential, remote, and dimensional adjustments on your actual SKU mix. The sticker price on a rate card is the starting point, not the number that hits your bank account at month-end. Operators who skip this step routinely find their true cost per order is 18 to 27 percent higher than the quoted base.
Workflow Hours: Where Picking Time Becomes Money
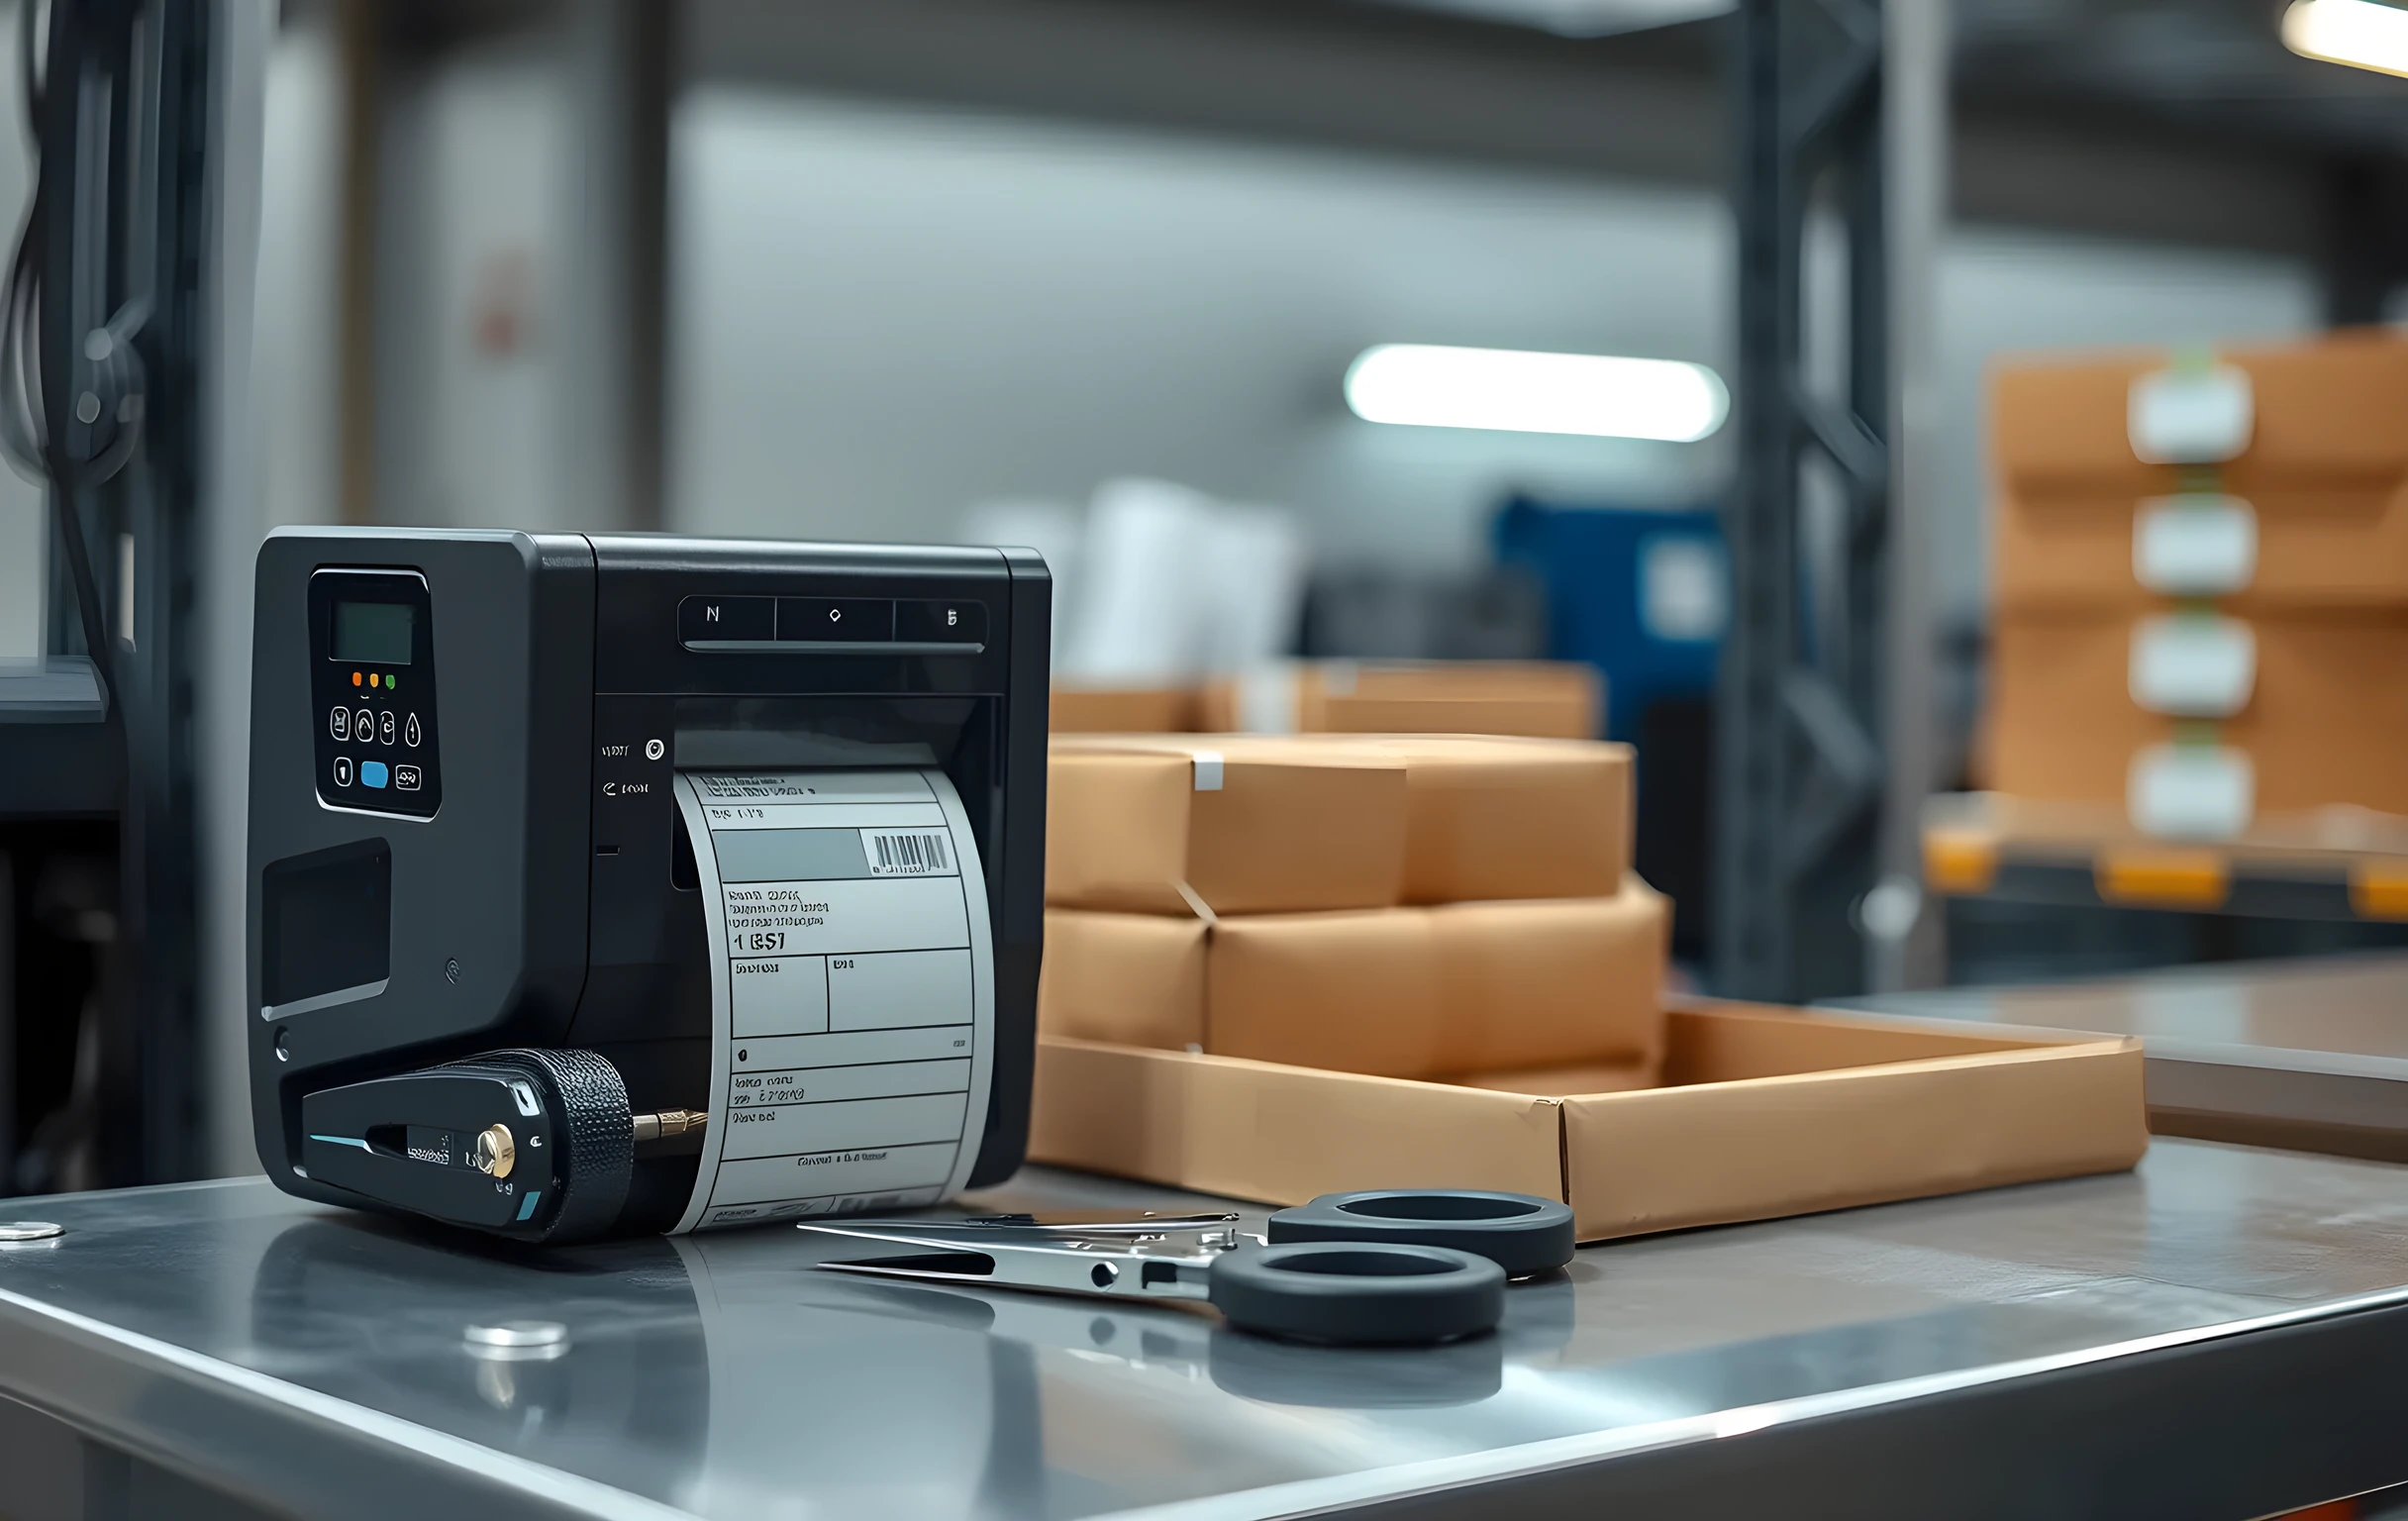
A well-mapped fulfillment workflow for a 600-square-foot operation in a western metro area runs 3.2 minutes per order from scan-to-seal for band-one items and 4.8 minutes for band-two, assuming the picker is within 40 feet of the bin. Add a second person for wave-picking above 15 orders per hour and that drops to 2.6 and 3.9 minutes respectively. Multiply by 800 orders in a week and you are looking at 37 versus 52 labor-hours, a difference of $480 to $670 at prevailing warehouse rates before you account for the error-rate delta.
The workflow step that eats the most unproductive time is label re-issuance. When a carrier scan fails, a dimensional check triggers a rate change, or an address validation flags a missing unit number, the operator pulls the parcel back, reprints, rescans, and re-shelves it. In a store processing 900 parcels weekly, even a 4 percent re-issue rate costs roughly 36 minutes of pure dead time per week. Automating the address-validation and dimensional-check step before the label prints eliminates that loop entirely.
If you are evaluating whether to bring fulfillment in-house or outsource to a third-party logistics provider in your region, measure the handoff cost: the average 2.1 hours per day of receiving, QA, and staging time at an in-house operation versus the $0.45 to $0.85 per-order pick-and-pack fee plus $0.20 to $0.35 for a quality-check scan at a 3PL. Below roughly 350 orders per week the in-house model usually wins on total cost; above that threshold the 3PL's amortized labor and carrier discounts pull the per-order number below your internal rate.
Show Up Where Buyers Are Asking Now
Here is the part most logistics comparisons miss: the buyer who types a question like shipping rates for western e-commerce or best carrier for Reno to Dallas into an AI assistant is not landing on your rate page. They are getting a synthesized answer in under three seconds, and if your pricing structure, zone coverage, and service tiers are not structured in a way that those engines can parse and cite, you simply do not exist in that decision. The buyer never sees your site. They see the model's summary, which was built from whatever it could extract cleanly.
The practical fix is not SEO keyword stuffing; it is publishing your tier structure, surcharge schedule, and per-order cost ranges as clean, self-contained blocks with explicit numbers, unit labels, and geographic qualifiers. When Perplexity or a Google AI Overview pulls an answer for someone comparing two fulfillment options in the Pacific Northwest, it will cite the source that stated $4.20 to $6.80 per 1-pound parcel within 150 miles of a hub in plain language rather than one buried in a PDF rate card behind a login wall.
Treat your shipping-rate page as a product listing for a service: name the tier, state the price range, list what is included (fuel, residential, dimensional), name the geography, and give the delivery window. Four data points per tier, written in sentences a person can read and an engine can extract. That single formatting shift has moved operators from page three of comparison results into the top two cited sources for their region's shipping-cost queries.
Building the Decision Matrix Before You Sign
Pull your last 90 days of order data and sort by destination zip or postcode. Bucket them into three geographic rings: within 150 miles of your fulfillment point, 150 to 500 miles, and beyond. For each bucket, record the weight distribution (how many parcels are under 1 pound, 1 to 3, 3 to 8, over 8) and the current per-order cost including every surcharge. That gives you a nine-cell grid with real numbers in it.
Now lay two or three candidate carriers or 3PLs across those same nine cells and fill in their quoted all-in rates. The cells where option A is cheaper than option B by more than 15 percent are your negotiation leverage; the cells where they are within 5 percent are where service reliability and API integration quality should break the tie. Do not average the grid. A carrier that wins two cells at $3.20 and loses three at $8.90 is a worse deal than one that is $4.10 across all five.
Finally, price in the workflow cost you measured earlier: the minutes per order for your team to generate labels, resolve errors, and handle returns for each carrier. A carrier that is 30 cents cheaper per parcel but adds 45 seconds of label-retry time per shipment will cost you more in labor than it saves in freight once you are past 400 orders a week. The total cost per order is the shipping rate plus the labor minutes multiplied by your loaded hourly rate, and that sum is the number to put in your contract.