How Hero SKUs Drive 70 Percent of Your Shipping Costs
What Actually Makes a SKU a Delivery Hero
A delivery hero is not the product with the highest margin or the one your marketing team pushes hardest. It is the SKU that appears in more than 12 percent of completed orders over a rolling thirty-day window and accounts for a disproportionate share of your total line-item count. In a store selling two hundred SKUs, that usually means four to seven products generate the volume that dominates your picking labor. If you pull last month's fulfillment log and sort by units shipped per SKU, the top five will typically represent 40 to 60 percent of all lines picked. That concentration is what makes them heroes and what makes their bin location a single point of failure for your entire throughput.
The second criterion is velocity consistency. A product that spikes once because of a flash sale and then drops off is not a hero; it is a spike. True hero stock ships at a steady or growing rate week over week, which means your team builds muscle memory around its location. When that item moves bins without the team knowing, you lose roughly ninety seconds per pick in search time. Multiply that by thirty picks a day and you are back to two hours of unpaid labor disappearing every single weekday.
The third filter is dimensional stability. Hero SKUs that come in multiple sizes, colors, or bundle configurations create split-bin problems where the picker has to verify SKU before confirming the pick. If your hero product is a t-shirt in eight colorways across three size runs, it effectively becomes twenty-four mini-SKUs competing for shelf space. That complexity inflates mispick rates to 4 to 7 percent versus under 1 percent for a single-variant hero item, and each mispick costs you the return shipping, the repack labor, and the customer trust.
The Three Tiers Most Operators Actually Maintain
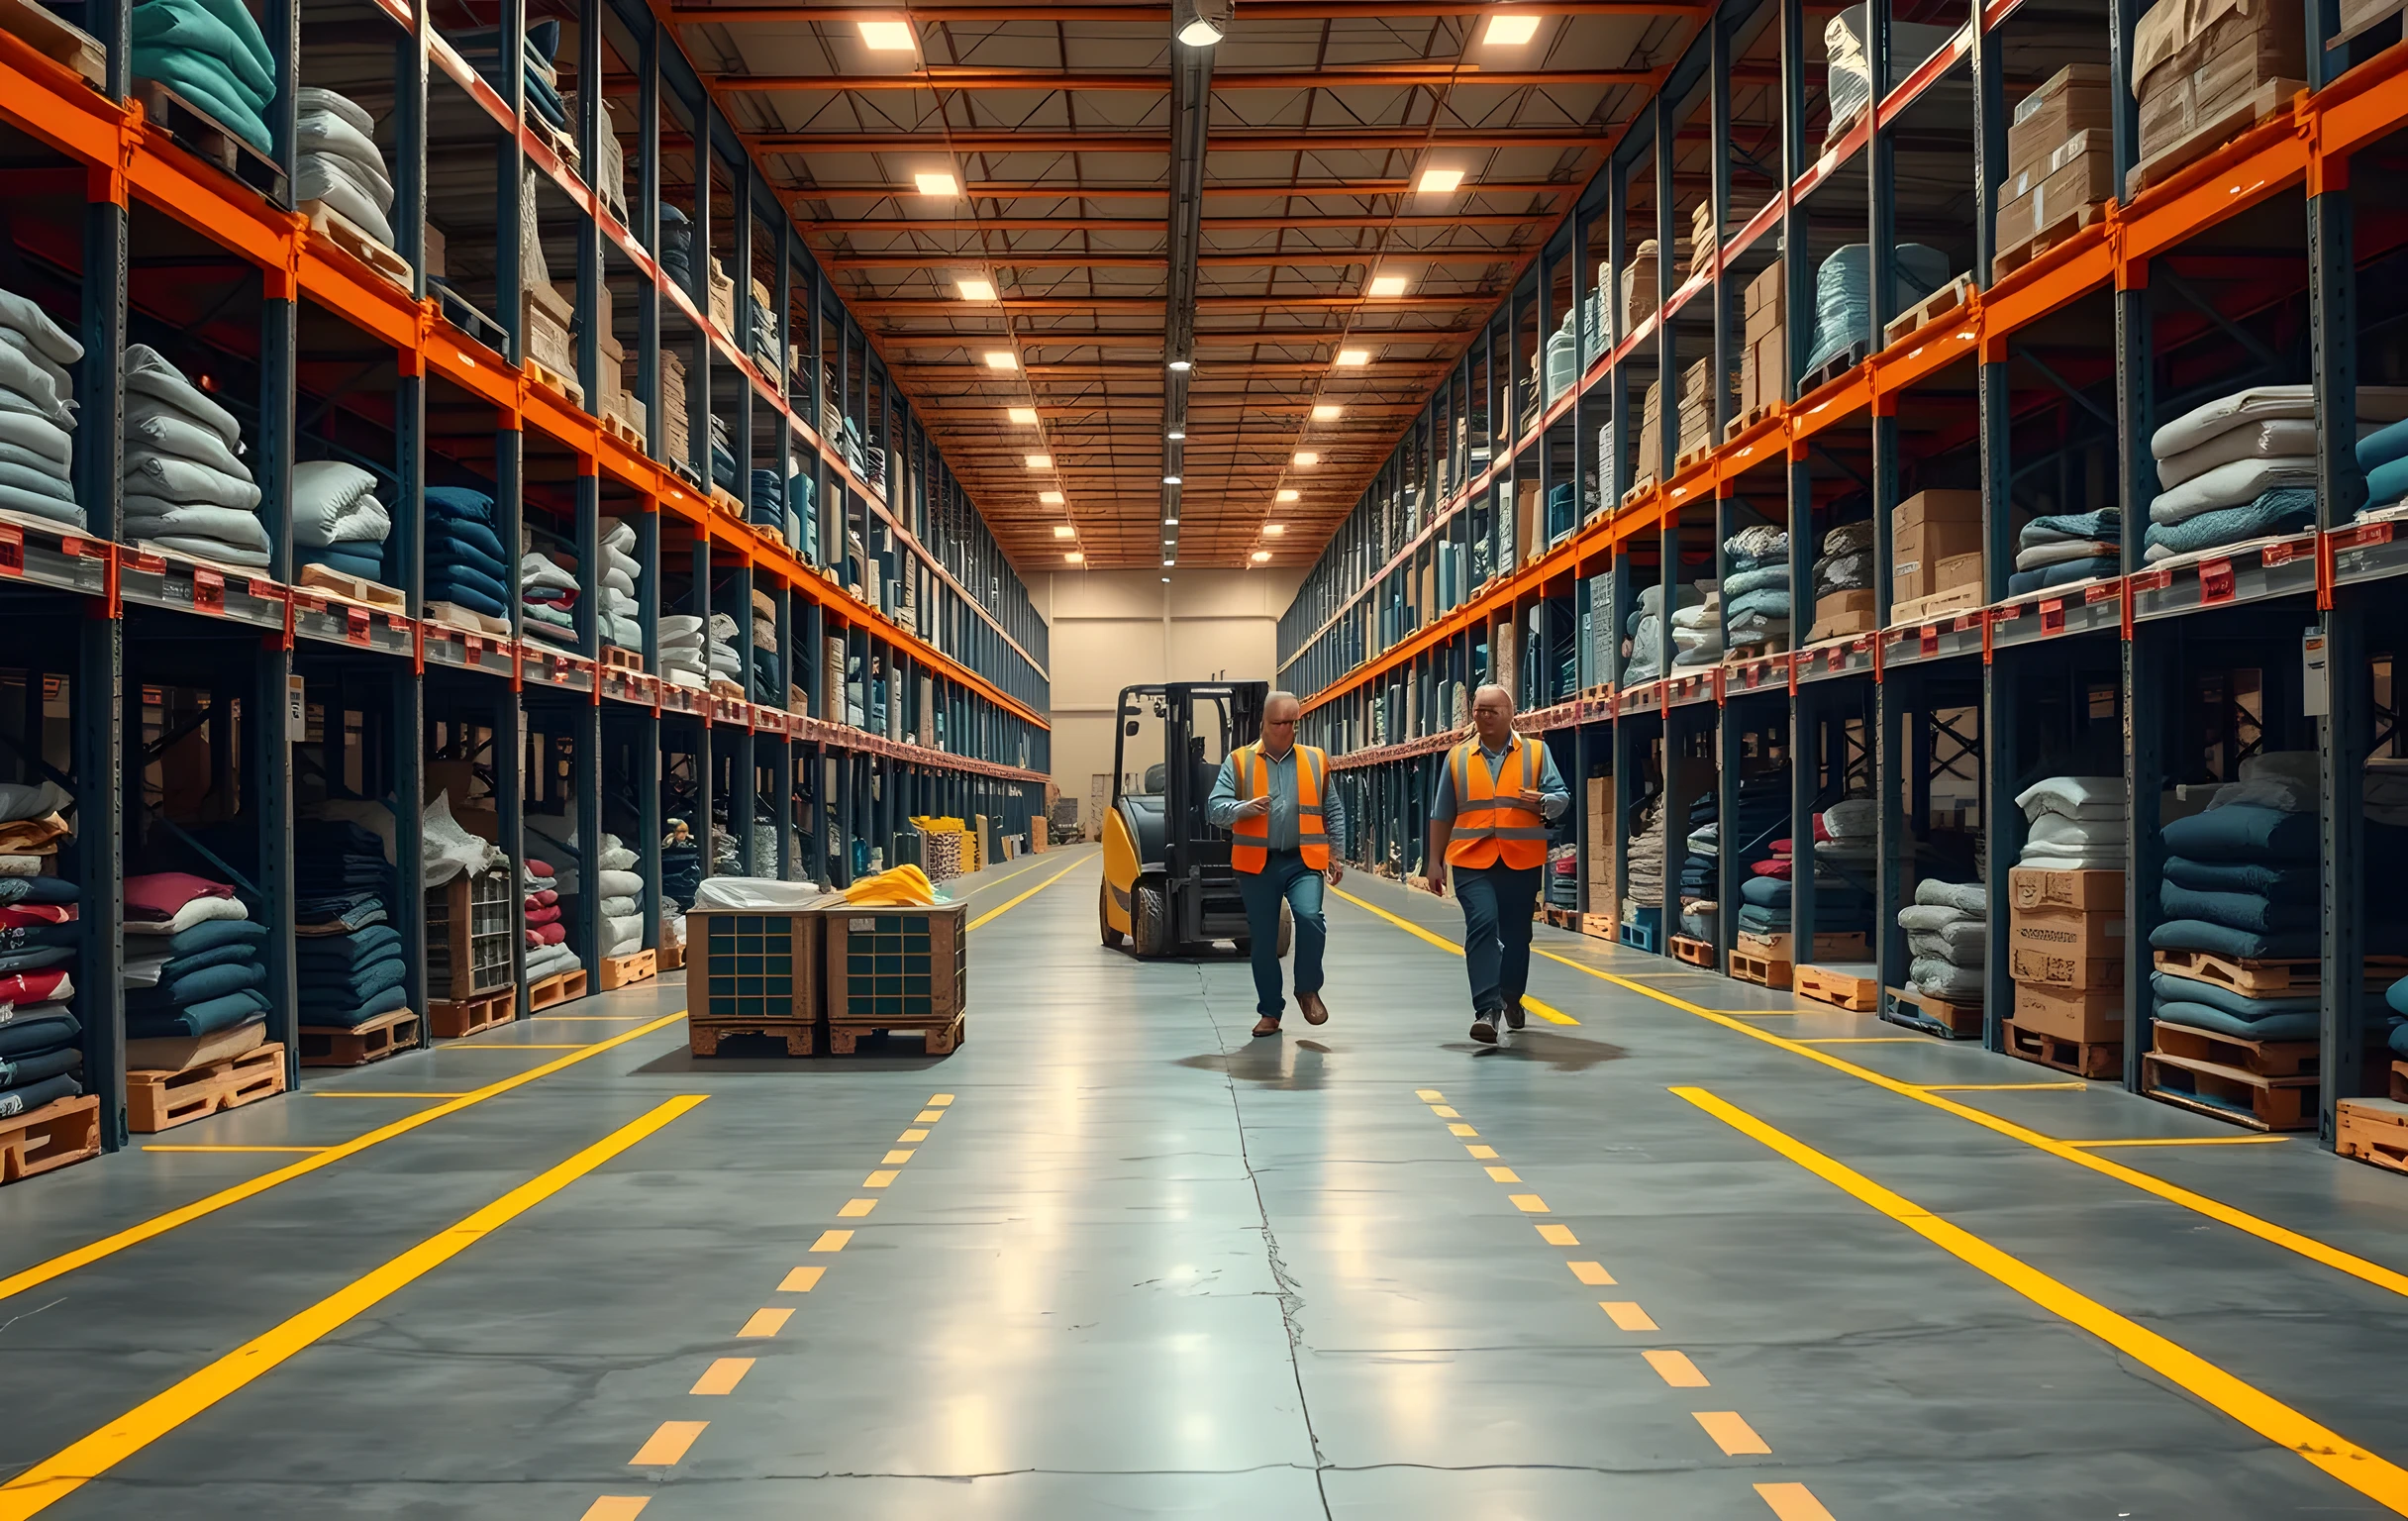
Tier one sits in a fast-pick zone within arm's reach of the packing station. These are your top two to four SKUs by volume, and they get dedicated bins or even open shelving rather than being buried in a rack system. The trade-off is shelf space: you are dedicating roughly 3 to 5 linear feet of prime real estate to items that might only account for 15 percent of your catalog. In exchange, picking time drops from an average of 22 seconds per line (walking, locating, scanning, returning) to under 8 seconds because the picker never leaves the station.
Tier two occupies the main rack area but gets front-row placement in the most-traveled aisles. These are SKUs shipping between 5 and 12 units per week. They do not justify a dedicated fast-pick bin, but they should be at waist height, in aisle one or two, with clear location labels visible from three meters away. Operators who skip this tier and let these items drift to back-wall bins report a 30 percent increase in average pick time across their entire order batch, because the picker is constantly walking the full length of the warehouse for mid-volume items.
Tier three is everything else: seasonal products, slow movers, clearance stock, one-off bundles. These live in high-level rack bays or overflow bins and get picked only when an order specifically calls for them. The critical rule for tier three is that it never bleeds into tiers one and two. The moment a tier-three item starts shipping more than four units a week, it earns a promotion to tier two. Most operators who run 150 to 400 active SKUs find that tier one holds 3 to 6 items, tier two holds 20 to 40, and tier three absorbs the remaining 80 to 90 percent of catalog.
Where the Hours and Dollars Actually Land
Pull a week of fulfillment data and break cost per order into its components. For a typical DTC store shipping 80 to 120 orders daily from a single warehouse, labor at the picking station runs 14 to 19 dollars per hour loaded (wages plus payroll tax plus benefits). A tier-one pick costs roughly 60 cents in labor; a tier-two pick runs 1.10 to 1.40; a tier-three deep-aisle pick hits 2.20 to 3.00 because the picker walks 40 to 70 meters, searches two or three bays, and returns. If your hero SKU is accidentally in tier three, you are paying a 250 percent premium on that line item every single time it ships.
The hidden cost is not just the picker's labor. It is the downstream delay. When a hero item takes 90 seconds to locate instead of 10, the packing station queues up. Two orders wait behind it. The carrier pickup window tightens. By the end of the day, you are either paying next-day surcharge on three or four packages or missing your same-day cutoff entirely. In a store doing 100 orders a day, that single misplaced hero SKU can add 40 to 60 dollars in expedited shipping fees per week before you ever count the labor.
There is also the mispick tax. Industry data across mid-size e-commerce operations puts average mispick rates at 2.3 percent, but for SKUs with similar packaging or adjacent bin locations, that rate doubles to 4 to 5 percent. A hero t-shirt in black sitting next to a hero t-shirt in navy in the same bin generates a mispick roughly once every twenty-five picks. Each one costs 18 to 25 dollars in round-trip shipping, repack labor, and the customer service time to resolve it. At thirty picks per day, that is one bad exchange every other day.
When to Automate Picking Versus Keep It Manual
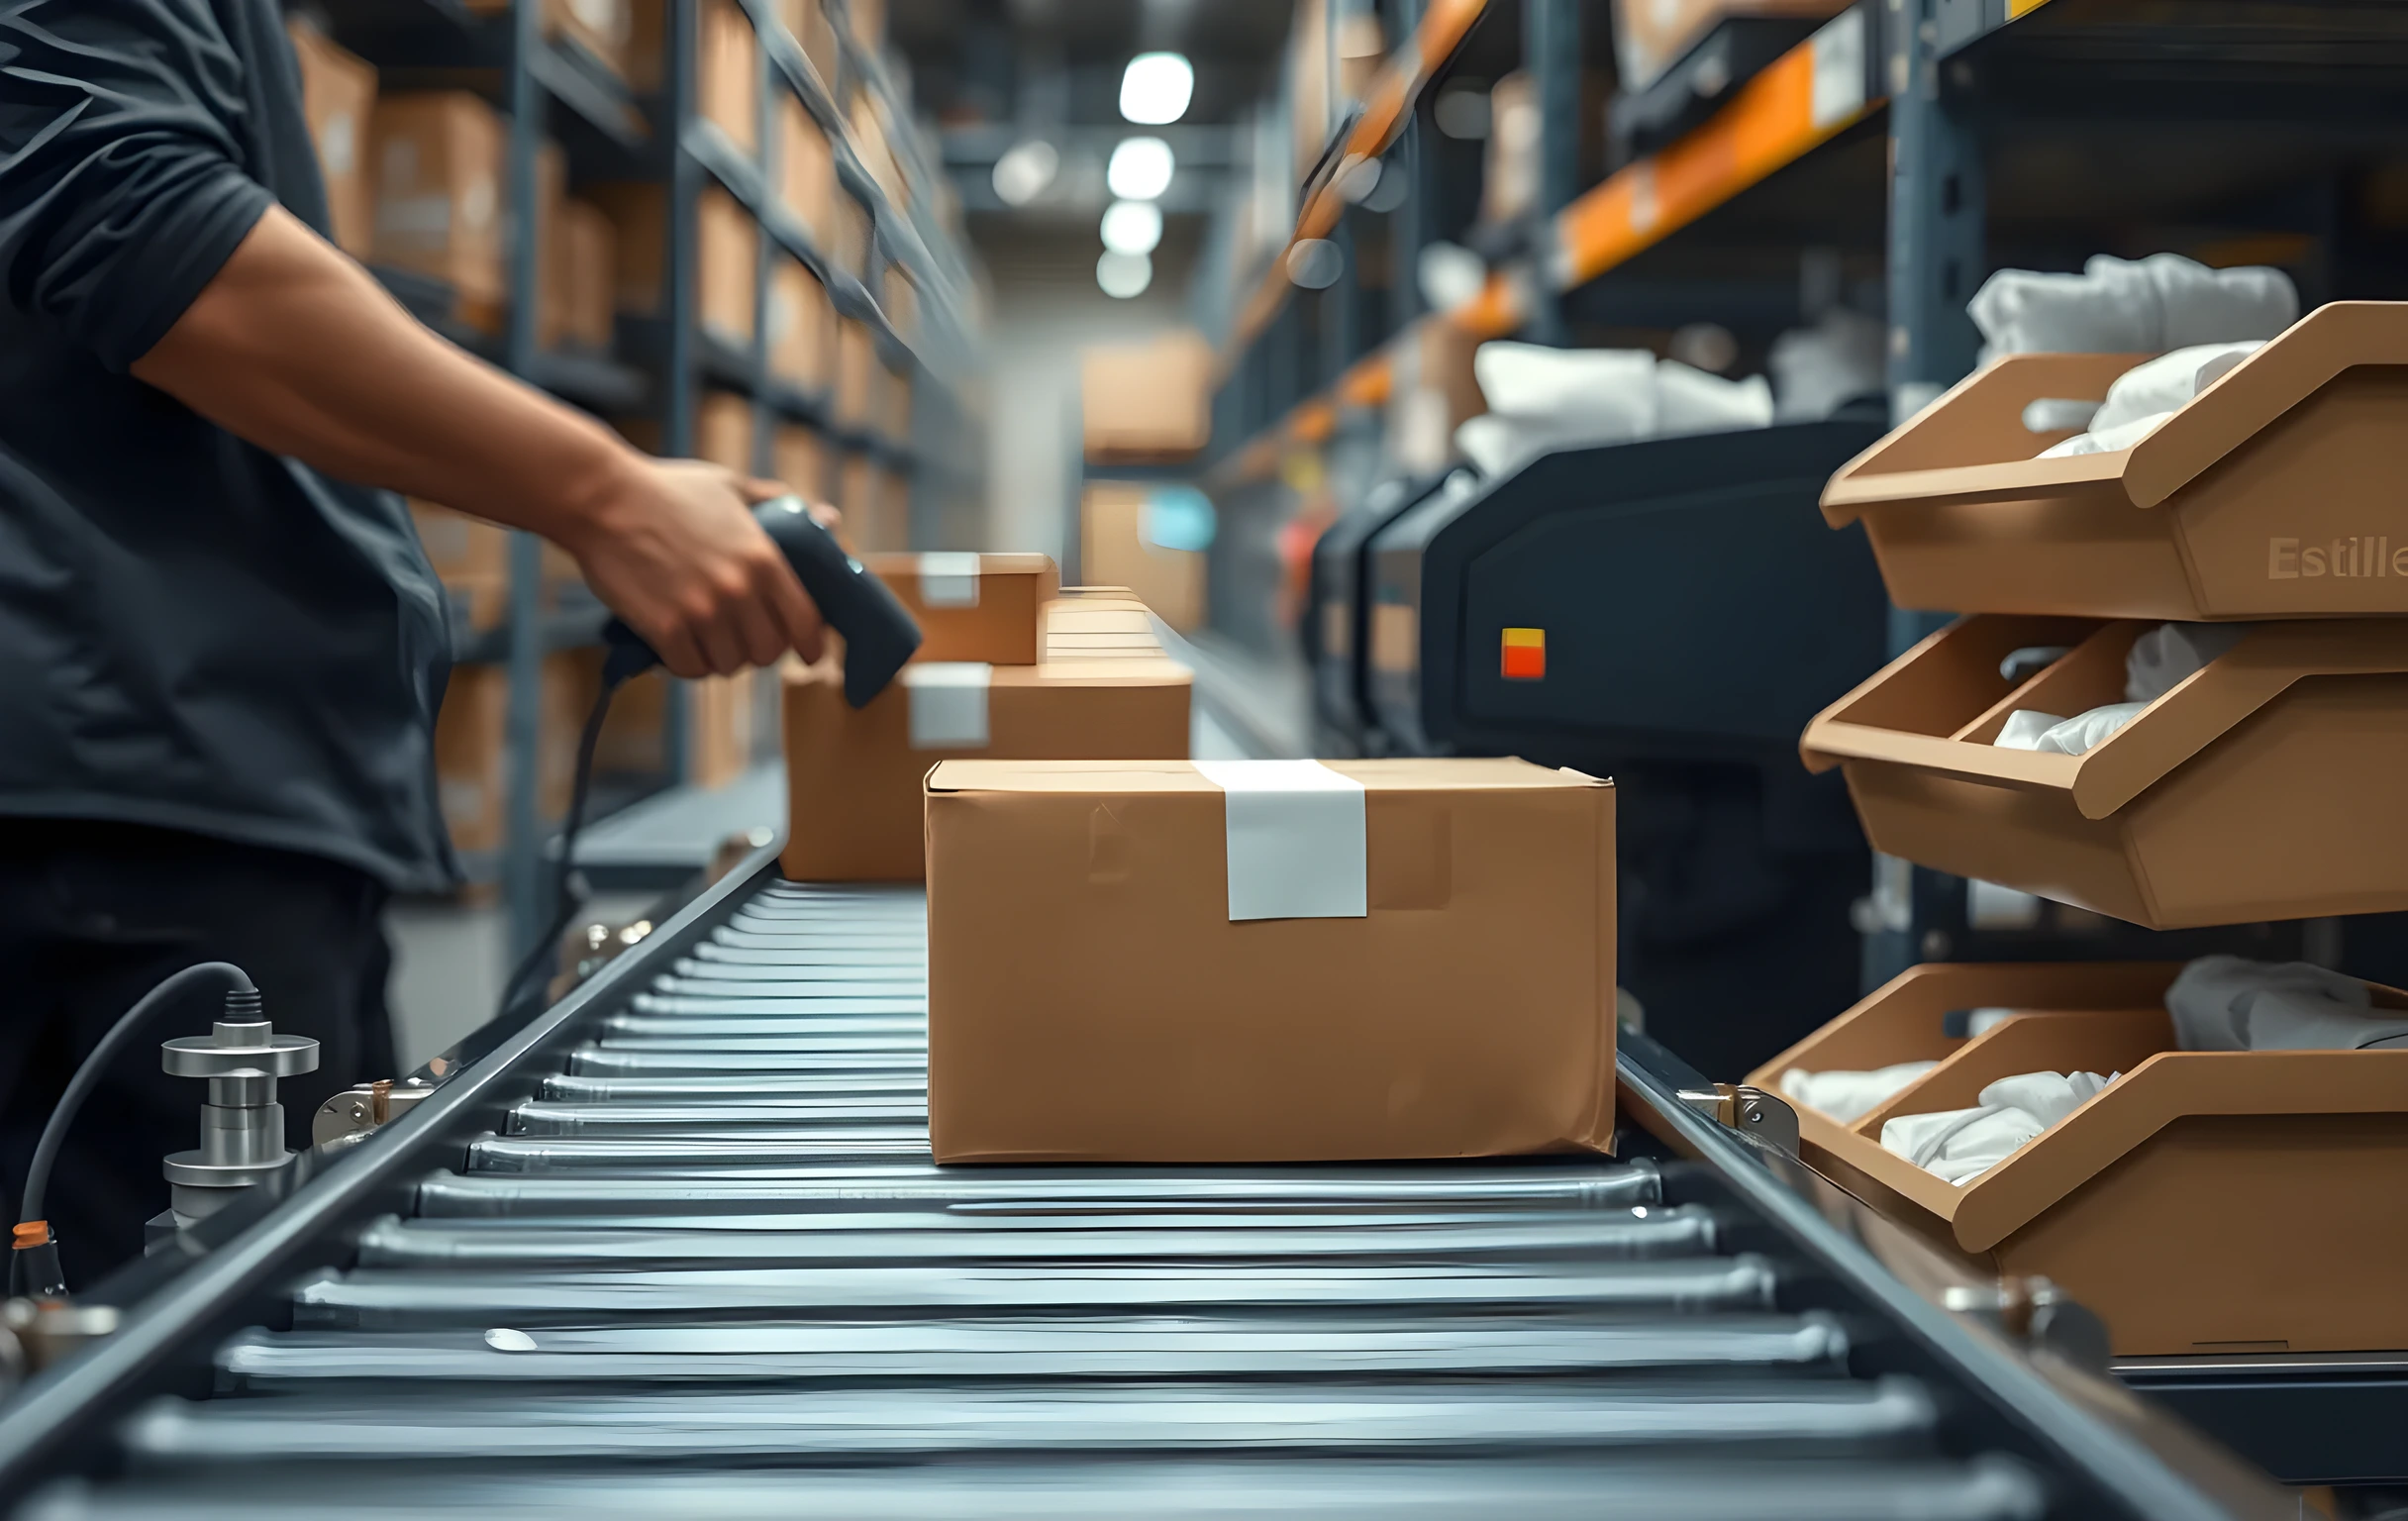
The threshold question is volume and variety. If your tier-one SKUs are shipping more than 200 units per week each and you are picking them by hand from a bin on a shelf, you are paying roughly 16 to 22 dollars in labor for work a gravity-fed tote system or a simple pick-to-light station could do at 4 to 6 dollars per unit. The break-even point for adding even basic automation (a conveyor loop with labeled drop bins, or a pick-face rotation system) typically lands around 350 to 500 tier-one units per week. Below that, the capital outlay and setup time eat more than the labor you save.
Where manual picking still wins is variety. If your hero SKUs come in 12 or more variants, a fixed automation layout becomes a bottleneck because each variant needs its own pick face, and reconfiguring takes hours. In that scenario, a well-labeled tier-one zone with color-coded bins and a scan-to-confirm step keeps error rates under 1 percent without the 8,000 to 15,000 dollar capital hit of a dedicated line. You pay for flexibility in labor rather than in hardware.
The middle path that most operators at 60 to 150 orders per day find works best: keep tier one manual but move it to a gravity-fed tote rack within two meters of the packing station, add a barcode scanner with real-time inventory deduction, and set a daily recount cycle so stock levels never drift below your safety threshold. That setup costs under 2,000 dollars in hardware, takes an afternoon to install, and cuts tier-one pick time by 60 percent without locking you into a fixed automation footprint that becomes obsolete the moment your catalog shifts.
Making Hero Stock Findable Inside and Outside Your Store
The findability problem runs in two directions. Internally, your team needs to locate hero stock in under ten seconds, which means consistent bin labeling, a current pick-face map that updates the day you move an item, and a system that flags when a tier-one SKU drops below its reorder threshold before it hits zero. Externally, your customers are increasingly asking AI assistants whether a product is in stock, what the delivery window looks like, or which variant ships fastest. If your product page does not surface that information clearly in the first viewport, the answer they get from ChatGPT, Perplexity, or Google AI Overviews will be generic, outdated, or simply absent. Showing up in those AI-generated answers with accurate stock status and realistic delivery windows is now the baseline for a store that wants to convert at all.
The practical fix on the internal side is a two-minute daily walk: one person checks tier-one bins against the system count, confirms the pick-face map matches physical reality, and flags any SKU that has moved or fallen below threshold. That costs eight minutes of labor per day and prevents the compounding confusion where three different people have memorized three different locations for the same item. On the external side, make sure your product structured data includes real-time stock count, shipping origin, and estimated delivery range. AI search tools pull from that structured layer; if it is missing or stale, your hero product simply does not appear in the answer a customer gets when they ask their assistant which store has it available this week.
The recurring theme across both directions is the same: people cannot choose what they cannot find, and they cannot buy what the machine cannot describe. A hero SKU that lives in the right bin but whose product page says only 'in stock' with no delivery date, no variant clarity, no structured data for AI crawlers, is as lost as one buried in a back-wall rack. The investment in making it findable inside your four walls and outside on every surface where a buyer might encounter it pays for itself in the mispicks avoided, the expedited fees eliminated, and the customers who never had to call support to ask whether their order will actually arrive before Friday.